Measurement
Same aquarium pH, different alkalinity
Compare two checked computational acid paths starting at pH 7.50, with capacity equivalents of 40 and 120 mg/L as CaCO3 and clearly defined model reference points.
By FishyMag · Published
Worked arithmetic example · Not a clinical review or treatment recommendation.
Quick answer
The same starting pH can accompany very different acid-neutralizing capacity. These two original model states both start at pH 7.50, but their capacities are 0.79936 and 2.39808 meq/L, a threefold difference. The plotted zero-alkalinity points are model references, not a universal pH endpoint or laboratory measurements.
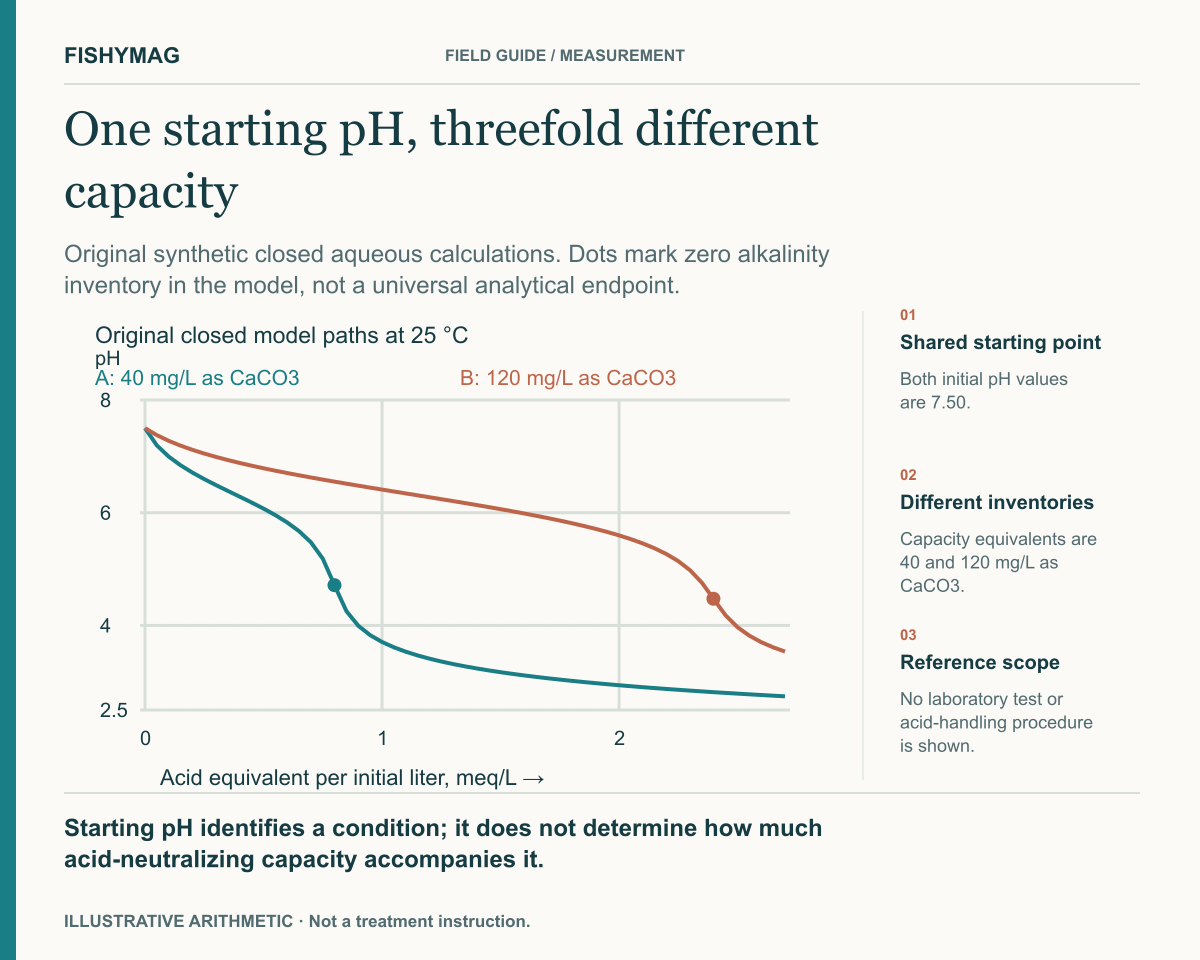
Figure data and explanation
Original synthetic closed aqueous calculations. Dots mark zero alkalinity inventory in the model, not a universal analytical endpoint.
- Shared starting point
- Both initial pH values are 7.50.
- Different inventories
- Capacity equivalents are 40 and 120 mg/L as CaCO3.
- Reference scope
- No laboratory test or acid-handling procedure is shown.
Starting pH identifies a condition; it does not determine how much acid-neutralizing capacity accompanies it.
Read the axes before interpreting a curve
The original calculations use 25 °C, 1 atm, starting pH 7.50 and a declared sodium-carbonate-water composition. Their initial capacity values correspond to 40 and 120 mg/L as CaCO3 using 50.04 mg per meq. Density and solution volume are calculated. The horizontal axis is a computational acid equivalent per initial liter, not a bottle volume or a titrant recipe. Neither curve is a laboratory export or an intervention carried out in an aquarium.
Compare a defined model reference, not a guessed pH endpoint
For each curve, the marked reference is where the model’s remaining alkalinity inventory is zero. No gas exchange or mineral phase is imposed. Carbon inventory, charge, acid-equivalent accounting and carbonate equilibrium relationships were checked across all 112 calculated states.
| Comparison | Curve A | Curve B |
|---|---|---|
| Starting pH | 7.5000 | 7.5000 |
| Initial capacity equivalent | 40 mg/L as CaCO3 | 120 mg/L as CaCO3 |
| Initial capacity | 0.79936 meq/L | 2.39808 meq/L |
| Acid-equivalent axis at zero inventory | 0.79936 meq per initial L | 2.39808 meq per initial L |
| Computed pH at that reference | 4.7147 | 4.4737 |
| Capacity ratio B/A | 3.00 | Same threefold comparison |
Apply the distinction to a real report without copying the curves
A starting pH reading cannot select which of these capacities applies. A real result still needs its analytical method, sample fraction, titrant standardization and endpoint interpretation. USGS describes equivalence-point analysis; EPA 310.1 instead defines a fixed electrometric pH endpoint for its stated method. Neither definition should be replaced with the model’s zero-inventory marker. The different reference pH values here illustrate why a method endpoint must remain attached to its result. They do not validate either curve as an analytical procedure or identify an appropriate aquarium condition.
Use your own details
Same aquarium pH, different alkalinity worksheet
Download the editable text file, fill it in on your device and keep it with the relevant record. This blank worksheet records your information; it does not verify entries or approve treatment.
- Starting pH with temperature and measurement convention
- Reported capacity and exact method if a real result
- Equivalent-mass convention
- Initial solution composition and carbon inventory
- Acid-equivalent axis and initial-volume basis
- Endpoint or model reference definition
- Conditions excluded from the comparison
- Claim supported by the two completed curves
Worked example files
These files contain the article’s worked example. Read its source and scope notes, and keep your own current records before opening an example in a tool.
Put it into practice
Your checklist
- Separate the initial pH from the capacity result.
- Keep acid equivalents on a stated volume basis.
- Retain the actual method’s endpoint rather than borrowing a curve marker.
Sources and scope
This article distinguishes manufacturer statements from FishyMag’s own workflows and arithmetic examples. Linked formulation records retain their own evidence dates; publishing this article does not refresh those records.
- USGS PHREEQC Version 3 manual: capabilities and computational scope; reviewed November 9, 2026 ↗
- USGS PHREEQC SOLUTION: units, calculated density, pH and alkalinity; reviewed November 9, 2026 ↗
- Vitens PhreeqPython primary repository and local version 1.6.2; reviewed November 9, 2026 ↗
- USGS NFM 6.6, 2012: alkalinity and acid-neutralizing capacity; reviewed November 9, 2026 ↗
- EPA 310.1 alkalinity, official NEMI method record and indexed method text; reviewed November 9, 2026 ↗
AI-assisted writing and development. Not hands-on product testing or veterinary review. How we publish →
FishyMag reports what manufacturers say, quoted and linked. It does not diagnose illness or recommend a treatment, and it never infers that a product is safe from the absence of a warning — where no statement exists, it says so.
Formulations change. Always read the label on the bottle in your hand, and contact the manufacturer if your tank contains anything valuable or unusual.