Keeper workflows
What a skimmer collection actually proves
Calculate target mass in one skimmer collection and distinguish recovery from causal removal.
By FishyMag · Published
Worked filtration evidence example · Not a clinical review or treatment recommendation.
Quick answer
The fictional cup contains 0.60 mg of the named analyte in its measured liquid fraction. That is 10% of the independently estimated 6 mg starting water inventory. The observation does not establish how much was removed solely through foam fractionation.
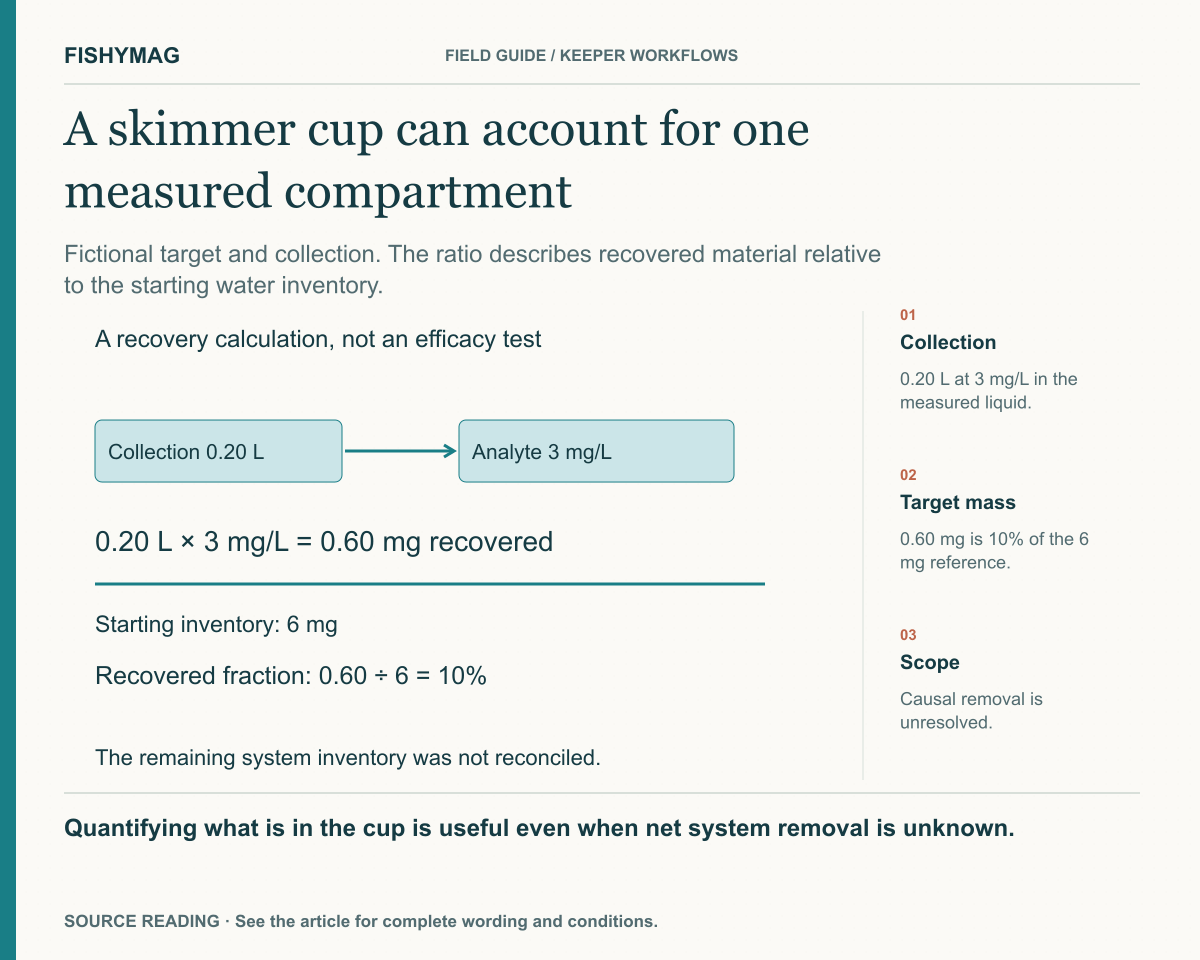
Figure data and explanation
Fictional target and collection. The ratio describes recovered material relative to the starting water inventory.
- Collection
- 0.20 L at 3 mg/L in the measured liquid.
- Target mass
- 0.60 mg is 10% of the 6 mg reference.
- Scope
- Causal removal is unresolved.
Quantifying what is in the cup is useful even when net system removal is unknown.
Name the fraction before multiplying
The fictional record pairs 0.20 L of skimmer liquid with a representative concentration of 3 mg/L for the named target. It does not measure solid material in the cup. Feldman’s skimmer work distinguishes a time series in the water from analyses of the skimmate itself, including separate fractions. A cup volume or colour cannot replace either analysis.
Calculate collection recovery and its reference fraction
The example states that the 6 mg initial water inventory is on a comparable target basis. No make-up-water or other export record is supplied.
| Quantity | Basis | Result |
|---|---|---|
| Target in collected liquid | 0.20 L × 3 mg/L | 0.60 mg |
| Relative to initial water inventory | 0.60 ÷ 6 × 100 | 10% recovered in this collection |
| Target in solids | Not measured | Unresolved |
| Net system loss and cause | Other inputs, outputs and end inventory missing | Unresolved |
Do not convert the cup fraction into a removal attribution
A better dossier would document the interval, final inventory, any make-up water or other export, and analytical recovery for each fraction. If the liquid concentration was measured on a filtered aliquot, its scope excludes solids that the analysis did not recover. The example only accounts for the cup liquid on its stated basis. It does not make a recommendation for skimmer settings or a judgement about livestock.
Use your own details
What a skimmer collection actually proves worksheet
Download the editable text file, fill it in on your device and keep it with the relevant record. This blank worksheet records your information; it does not verify entries or approve treatment.
- Analyte and measured fraction
- Collection volume and time interval
- Representative concentration and recovery
- Recovered mass calculation
- Comparable starting water inventory
- Other export and make-up water records
- Missing residual water and particulate measurements
Put it into practice
Your checklist
- Keep the collection interval and measured fraction.
- Match the inventory and recovered mass bases before taking a ratio.
- Record missing controls and other routes of export.
Sources and scope
This article distinguishes manufacturer statements from FishyMag’s own workflows and arithmetic examples. Linked formulation records retain their own evidence dates; publishing this article does not refresh those records.
- Feldman and colleagues, quantitative evaluation of protein skimmer performance (2009); reviewed November 9, 2026 ↗
- Feldman 2010 elemental analysis of skimmate; reviewed November 9, 2026 ↗
AI-assisted writing and development. Not hands-on product testing or veterinary review. How we publish →
FishyMag reports what manufacturers say, quoted and linked. It does not diagnose illness or recommend a treatment, and it never infers that a product is safe from the absence of a warning — where no statement exists, it says so.
Formulations change. Always read the label on the bottle in your hand, and contact the manufacturer if your tank contains anything valuable or unusual.