Keeper workflows
Does an adsorbent study represent aquarium water?
Compare two adsorption matrices without attributing the whole difference to one water constituent.
By FishyMag · Published
Worked filtration evidence example · Not a clinical review or treatment recommendation.
Quick answer
The fictional results differ by 35 percentage points, from 80% to 45%. Because salinity and background organics both changed, the comparison cannot identify organic competition as the cause. Preserve both changes in the evidence record.
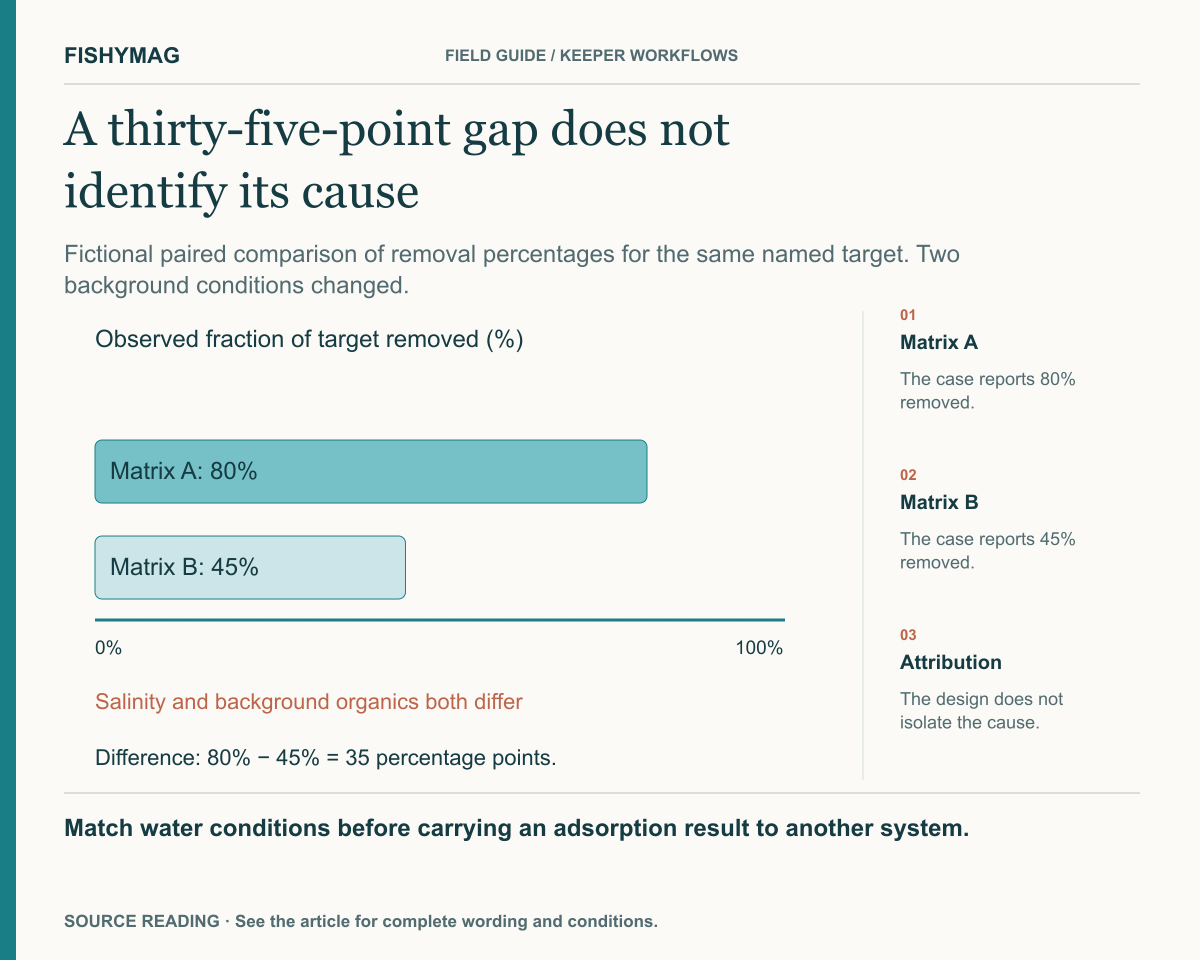
Figure data and explanation
Fictional paired comparison of removal percentages for the same named target. Two background conditions changed.
- Matrix A
- The case reports 80% removed.
- Matrix B
- The case reports 45% removed.
- Attribution
- The design does not isolate the cause.
Match water conditions before carrying an adsorption result to another system.
List what actually changed between the tests
The fictional comparison holds carbon identity, target X, initial target concentration, loading and observation time fixed. Matrix B has different salinity and more background dissolved organics. The packet says paired assays met their separate recovery checks. In a real primary study, humic acid adsorption by powdered carbon varied with the salt matrix; some saline conditions produced greater adsorption. The real study does not give a universal direction for other targets.
Preserve both variables in the comparison
Percent removal refers to the same target and starting basis in this particular case. The two rows describe outcomes, not isolated causal effects.
| Evidence | Matrix A | Matrix B |
|---|---|---|
| Medium and target | Same carbon and target X | Same as A |
| Initial basis and contact window | Matched | Matched |
| Salinity and background organics | Reference salinity and organics | Both differ from A |
| Target removed | 80% | 45% |
| Analytical controls | Recovery check documented | Separate matrix recovery check documented |
Name a comparison that would address the proposed cause
A source isolating organic competition would hold salinity and other relevant conditions fixed while changing the documented organic background, or separate the factors in its design. That still leaves transfer to another aquarium dependent on the target, medium and matrix. The useful conclusion here is a 35-point difference between the two tested matrices and an unresolved explanation for it.
Use your own details
Does an adsorbent study represent aquarium water? worksheet
Download the editable text file, fill it in on your device and keep it with the relevant record. This blank worksheet records your information; it does not verify entries or approve treatment.
- Exact medium and target form
- Initial target concentration and analytical basis
- Medium loading and contact conditions
- Salinity and major ions in each matrix
- Background dissolved organics
- Matrix recovery and control information
- Observed difference and unisolated factors
Put it into practice
Your checklist
- Check target basis and analytical recovery in both waters.
- Record all matrix changes, including salinity.
- Do not attribute the difference to a factor the test did not isolate.
Sources and scope
This article distinguishes manufacturer statements from FishyMag’s own workflows and arithmetic examples. Linked formulation records retain their own evidence dates; publishing this article does not refresh those records.
- Adsorption of humic acid by powdered activated carbon in saline water conditions; reviewed November 9, 2026 ↗
- EPA verification protocol for organic contaminant removal; reviewed November 9, 2026 ↗
AI-assisted writing and development. Not hands-on product testing or veterinary review. How we publish →
FishyMag reports what manufacturers say, quoted and linked. It does not diagnose illness or recommend a treatment, and it never infers that a product is safe from the absence of a warning — where no statement exists, it says so.
Formulations change. Always read the label on the bottle in your hand, and contact the manufacturer if your tank contains anything valuable or unusual.