Keeper workflows
When an aquarium sensor samples the same part of every cycle
Work a synthetic four-minute temperature cycle to show why sampling at one repeated phase can produce a flat record despite constructed peaks.
By FishyMag · Published
Worked arithmetic example · Not a clinical review or treatment recommendation.
Quick answer
The synthetic signal is 24.0 °C at minutes 0 and 4 and 24.6 °C at minute 2, repeating every four minutes. Sampling only at 0, 4, 8 and 12 gives four values of 24.0 °C. That flat record cannot exclude this specified cycle. It is a mathematical counterexample, not measured aquarium heater behavior.

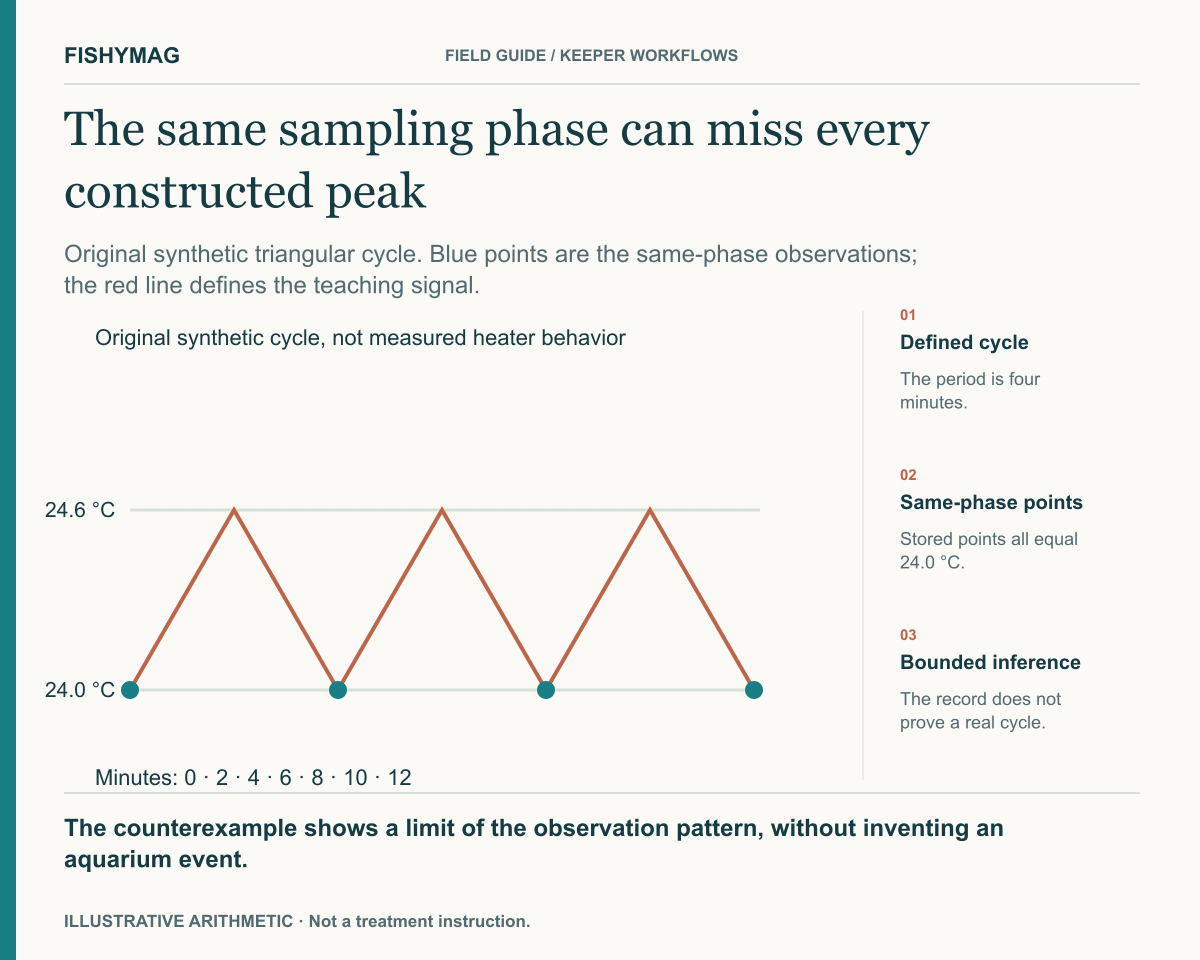
Figure data and explanation
Original synthetic triangular cycle. Blue points are the same-phase observations; the red line defines the teaching signal.
- Defined cycle
- The period is four minutes.
- Same-phase points
- Stored points all equal 24.0 °C.
- Bounded inference
- The record does not prove a real cycle.
The counterexample shows a limit of the observation pattern, without inventing an aquarium event.
Define the counterexample completely
The plotted synthetic signal connects the stated points linearly and repeats with a four-minute period. The connecting lines define this teaching model only; they are not a claim about thermal dynamics or a real controller. Blue points occur at one repeated phase of that constructed cycle.
Complete both observation sets
The first set is flat by construction. The second set adds times at the synthetic peaks and therefore answers a different coverage question.
| Observation set | Times, minutes | Values, °C | Finding |
|---|---|---|---|
| Repeated same phase | 0, 4, 8, 12 | 24.0, 24.0, 24.0, 24.0 | Flat stored set |
| Added opposite phase | 2, 6, 10 | 24.6, 24.6, 24.6 | Constructed peaks become visible |
| Full synthetic signal | Declared four-minute cycle | 0.6 °C peak-to-trough | No physical aquarium experiment |
| Real logger interpretation | Actual channel and processing needed | Not supplied by the counterexample | No universal sampling recommendation |
Use the example to qualify the claim, not to configure equipment
A flat sampled record is compatible with more than one intervening signal. It can therefore fail to exclude this particular cycle without proving that the cycle occurred. Real interpretation also needs sensor response, smoothing, interval summaries and timing evidence. The completed worksheet limits what the existing record can rule out; it does not prescribe a logging rate or identify a faulty heater.
Use your own details
When an aquarium sensor samples the same part of every cycle worksheet
Download the editable text file, fill it in on your device and keep it with the relevant record. This blank worksheet records your information; it does not verify entries or approve treatment.
- Actual channel and sampling-time definition
- Synthetic versus measured signal status
- Declared cycle period and phase
- Stored observation times
- Values observed at each phase
- Independent observations at other phases
- Which cycle the record can or cannot exclude
- Real sensor and logger limitations not represented
Put it into practice
Your checklist
- Retain sampling phase as well as interval.
- Keep synthetic cycles separate from measured behavior.
- Do not infer an intervening flat signal from flat sampled points.
Sources and scope
This article distinguishes manufacturer statements from FishyMag’s own workflows and arithmetic examples. Linked formulation records retain their own evidence dates; publishing this article does not refresh those records.
- GHL ProfiLux4/4e GHL Connect resource guide, June2020; reviewed November 9, 2026 ↗
- Hanna HI98194/HI98195/HI98196 instruction manual; reviewed November 9, 2026 ↗
AI-assisted writing and development. Not hands-on product testing or veterinary review. How we publish →
FishyMag reports what manufacturers say, quoted and linked. It does not diagnose illness or recommend a treatment, and it never infers that a product is safe from the absence of a warning — where no statement exists, it says so.
Formulations change. Always read the label on the bottle in your hand, and contact the manufacturer if your tank contains anything valuable or unusual.